Does Your State Have the Worst Roads? It Could Be Costing You Big Time
Of the major projects on President Biden’s agenda, the new administration is considering a $3 trillion spending bill to improve infrastructure. According to various media outlets, it would include repairing roadways and updating transportation systems. That’s good news for many of us with higher-than-normal car maintenance costs thanks to driving on bad roads.
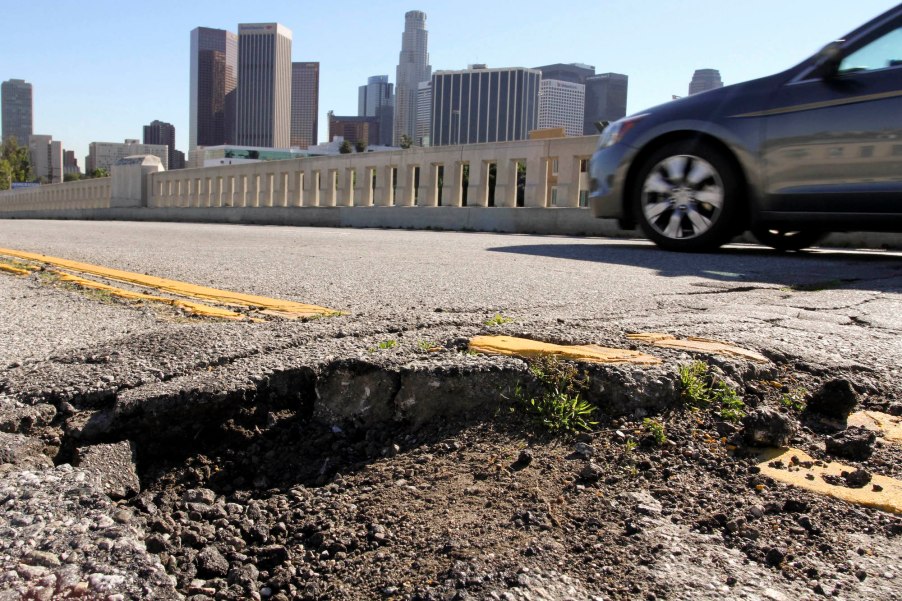
It turns out you don’t need to watch World’s Most Dangerous Roads when cities like Tulsa, Oklahoma, have potholes covering 50 to 75 percent of the roads.
Aging roads cost drivers over $500 annually
The insurance comparison shopping website QuoteWizard recently published “States With the Worst Road Infrastructure.” According to the study, new statistics from the Federal Highway Administration (FHA) reveal aging roadways in some states cost vehicle owners $560 to $1,000 annually in unnecessary vehicle maintenance. In fact, QuoteWizard points out that over 20 percent of roads and about 6 percent of bridges nationwide are in “poor” or “non-acceptable” shape.
“The high costs are a direct result of a combination of what the FHA considers non-acceptable roads and poor bridge decks. The more non-acceptable roads and poor bridge decks a state has, the more drivers are paying,” the study reports. “For example, In California, 35 percent of roads are non-acceptable, and drivers pay an average of $862 per motorist in taxes and fees. In North Carolina, though, 14 percent of roads are non-acceptable, and drivers pay only $336 per motorist.”
States that spend the most on infrastructure have the worst roads
One of the most interesting observations QuoteWizard makes is that states with higher infrastructure funding as measured per driver tend to have poorly maintained roads. Take, for example, the top three states with the worst road infrastructure: Rhode Island, Mississippi, and West Virginia.
QuoteWizard’s research shows that Rhode Island, the first-place loser, spends only 2 percent of its infrastructure funding on road maintenance, costing $823 per motorist. Mississippi is the second-worst, allocating 4 percent of its infrastructure funding toward road maintenance, at $820 per motorist. Then you have West Virginia, ranked the third-worst, using 19 percent of its infrastructure funding on maintaining roads but for $100 less per motorist.
However, it’s important to consider the following: population density, the amount of traffic from a state’s residents versus passers-through, and the number of items a state considers “infrastructure” requiring a portion of the funding. According to Infrastructure Report Card, Rhode Island has 16 infrastructure-related categories. They include Port of Providence, one of the busiest, deepest, and strategically important seaports in the nation. Plus, Rhode Island’s total population barely exceeds 1 million.
West Virginia Public Broadcasting reported that the state has a population under 3 million yet the nation’s sixth-largest transportation system. When you consider cities like Chicago have an almost larger population than West Virginia, the cost-per-motorist issue becomes clearer. After all, transient traffic doesn’t pay the taxes.
Other notable findings
Besides the states previously mentioned, Oklahoma ranks first in highest road maintenance cost per motorist at $900. Indeed, as shown in the video above, it ranks among the top five states for worst roads.
Coming in at a somewhat close second is California, with a cost of $862. New Mexico costs resident motorists $768, making it the nation’s fifth most expensive. Though Florida likely sees a high volume of transient traffic, it ranks 47th, with a cost of $351 per resident motorist. QuoteWizard lists Tennessee 50th with a cost of $194. And though Wyoming drivers pay a fairly median $356, they can boast the best-maintained roads in the nation.
Overall, looking at America’s poor infrastructure problem through a broader lens, QuoteWizard estimates “that driving on poor-condition roads costs motorists $120 billion in vehicle repairs and operating costs.”


